$ Home Project Cost Guide
Aerial view of American residential neighborhood with various home improvement projects underway
📊 2026 Data Report

U.S. Home Project Cost Index

How much do major home improvements cost across the United States? This index compares mid-range planning estimates for 8 project categories across 10 of the most populated U.S. states — updated for 2026.

Last updated: May 2026

Key findings

Top-level takeaways from the 2026 U.S. Home Project Cost Index.

$118,500 National mid-range bundle

The combined mid-range estimate for all 8 major home projects at the national average level.

20% California premium

California costs run approximately 20% above the national average — the highest among the 10 states tracked.

5% Ohio savings

Ohio costs run approximately 5% below the national average — the most affordable among tracked states.

$29,625 Max state-to-state gap

The full project bundle in California costs $29,625 more than in Ohio.

8 Project categories tracked

Roof, HVAC, bathroom, kitchen, window, flooring, painting, and siding — the most common major home improvement projects.

Regional cost factor by state

How each state's overall cost level compares to the national average (1.00). Values above 1.00 indicate higher-than-average costs; below 1.00 means lower.

CA
1.20×
NY
1.18×
FL
1.12×
IL
1.08×
PA
1.05×
NC
1.01×
AZ
0.99×
TX
0.98×
GA
0.97×
OH
0.95×
National avg: 1.00×

State-by-state cost comparison

Mid-range planning estimates for each project in each state. All values are based on national base costs adjusted by each state's regional cost factor.

State Roof ReplacementHVAC ReplacementBathroom RemodelKitchen RemodelWindow ReplacementFlooring InstallationHouse PaintingSiding Replacement Total Bundle
CA California $19,200$12,600$18,000$42,000$14,400$12,000$9,600$14,400 $142,200
NY New York $18,880$12,390$17,700$41,300$14,160$11,800$9,440$14,160 $139,830
FL Florida $17,920$11,760$16,800$39,200$13,440$11,200$8,960$13,440 $132,720
IL Illinois $17,280$11,340$16,200$37,800$12,960$10,800$8,640$12,960 $127,980
PA Pennsylvania $16,800$11,025$15,750$36,750$12,600$10,500$8,400$12,600 $124,425
NC North Carolina $16,160$10,605$15,150$35,350$12,120$10,100$8,080$12,120 $119,685
AZ Arizona $15,840$10,395$14,850$34,650$11,880$9,900$7,920$11,880 $117,315
TX Texas $15,680$10,290$14,700$34,300$11,760$9,800$7,840$11,760 $116,130
GA Georgia $15,520$10,185$14,550$33,950$11,640$9,700$7,760$11,640 $114,945
OH Ohio $15,200$9,975$14,250$33,250$11,400$9,500$7,600$11,400 $112,575
US National Avg $16,000$10,500$15,000$35,000$12,000$10,000$8,000$12,000 $118,500

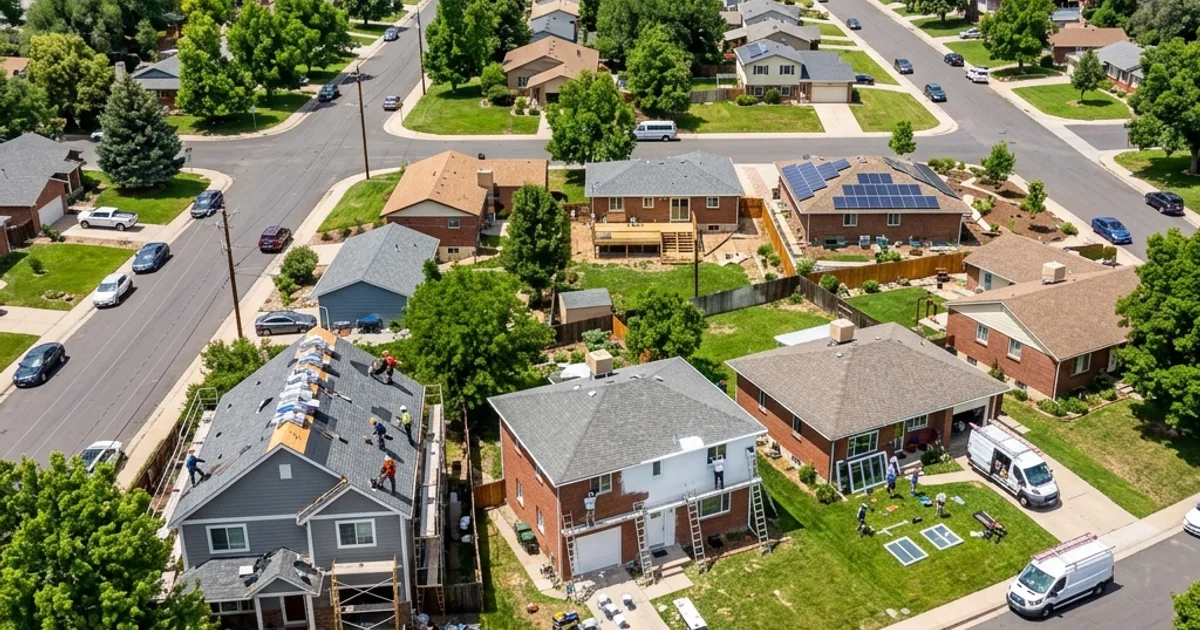
What drives state-level cost differences?

The same home improvement project can cost 20–35% more in one state than another. The main drivers behind these differences include:

  • Labor rates — Regional wage differences, union prevalence, and contractor supply directly affect the labor portion of any estimate.
  • Material costs — Shipping distances, local supplier networks, and regional demand affect material pricing.
  • Building codes — States with stricter code requirements (seismic, hurricane, energy efficiency) often have higher installation costs.
  • Permit fees — Permit costs vary widely between jurisdictions, from under $100 to over $1,000 for the same project type.
  • Market demand — Fast-growing states with housing booms experience higher contractor demand and pricing pressure.
  • Climate — Extreme weather conditions require specialized materials and techniques that add cost.

For a deeper explanation, see our guide on why contractor quotes vary.

How to use this data

  • Use the state comparison to set realistic budget expectations before getting quotes.
  • Compare your actual contractor quotes against the mid-range estimates for your state.
  • Use the total bundle to understand the relative cost of living in different states for homeowners.
  • Combine this data with our quote comparison template for a complete planning workflow.

Methodology

Estimates in this index are based on national mid-range base costs for each project category, adjusted by state-level cost factors derived from regional labor rates, material pricing, permit fee structures, and market demand indicators.

These are planning-level estimates, not contractor quotes. Actual project costs will vary based on specific scope, materials, home condition, and local contractor pricing.

For full details, see our Methodology page.

Cite this data

Journalists, researchers, real estate professionals, and content creators are welcome to cite data from this index with proper attribution.

Citation format: "U.S. Home Project Cost Index 2026." Home Project Cost Guide, May 2026. https://ushomecostguide.com/home-project-cost-index/
Embed link: <a href="https://ushomecostguide.com/home-project-cost-index/">U.S. Home Project Cost Index 2026</a> — Source: US Home Cost Guide

Frequently asked questions

How are these cost estimates calculated?

Each estimate starts with a national mid-range base cost for the project category. State-level adjustments are applied using regional cost factors that account for local labor rates, material costs, permit fees, and market demand. See our methodology page for full details.

Why are California and New York costs so much higher?

Both states have above-average labor rates, stricter building codes, higher permit costs, and greater demand for contractors — all of which push project costs above the national average.

Are these actual contractor prices?

No. These are planning-level estimates designed to help homeowners understand relative cost differences between states and project types. Actual contractor quotes will vary based on specific project details, materials, and local conditions.

How often is this data updated?

We review and update the U.S. Home Project Cost Index periodically as material costs, labor rates, and regional market conditions change. The current data reflects estimates for 2026.

Can I cite this data in my article or report?

Yes. Journalists, researchers, and content creators are welcome to cite this data with attribution to Home Project Cost Guide. See the citation format at the bottom of this page.

HP
Home Project Cost Guide Editorial Team Research & Cost Analysis

Our editorial team researches and compiles home improvement cost data from contractor pricing surveys, manufacturer specifications, permit databases, and regional labor rate benchmarks to create practical planning estimates for U.S. homeowners.

✓ Published 200+ cost guides and calculators✓ Covers 25 U.S. states with localized pricing✓ Data sourced from contractor and industry benchmarks
Last reviewed: May 2026